
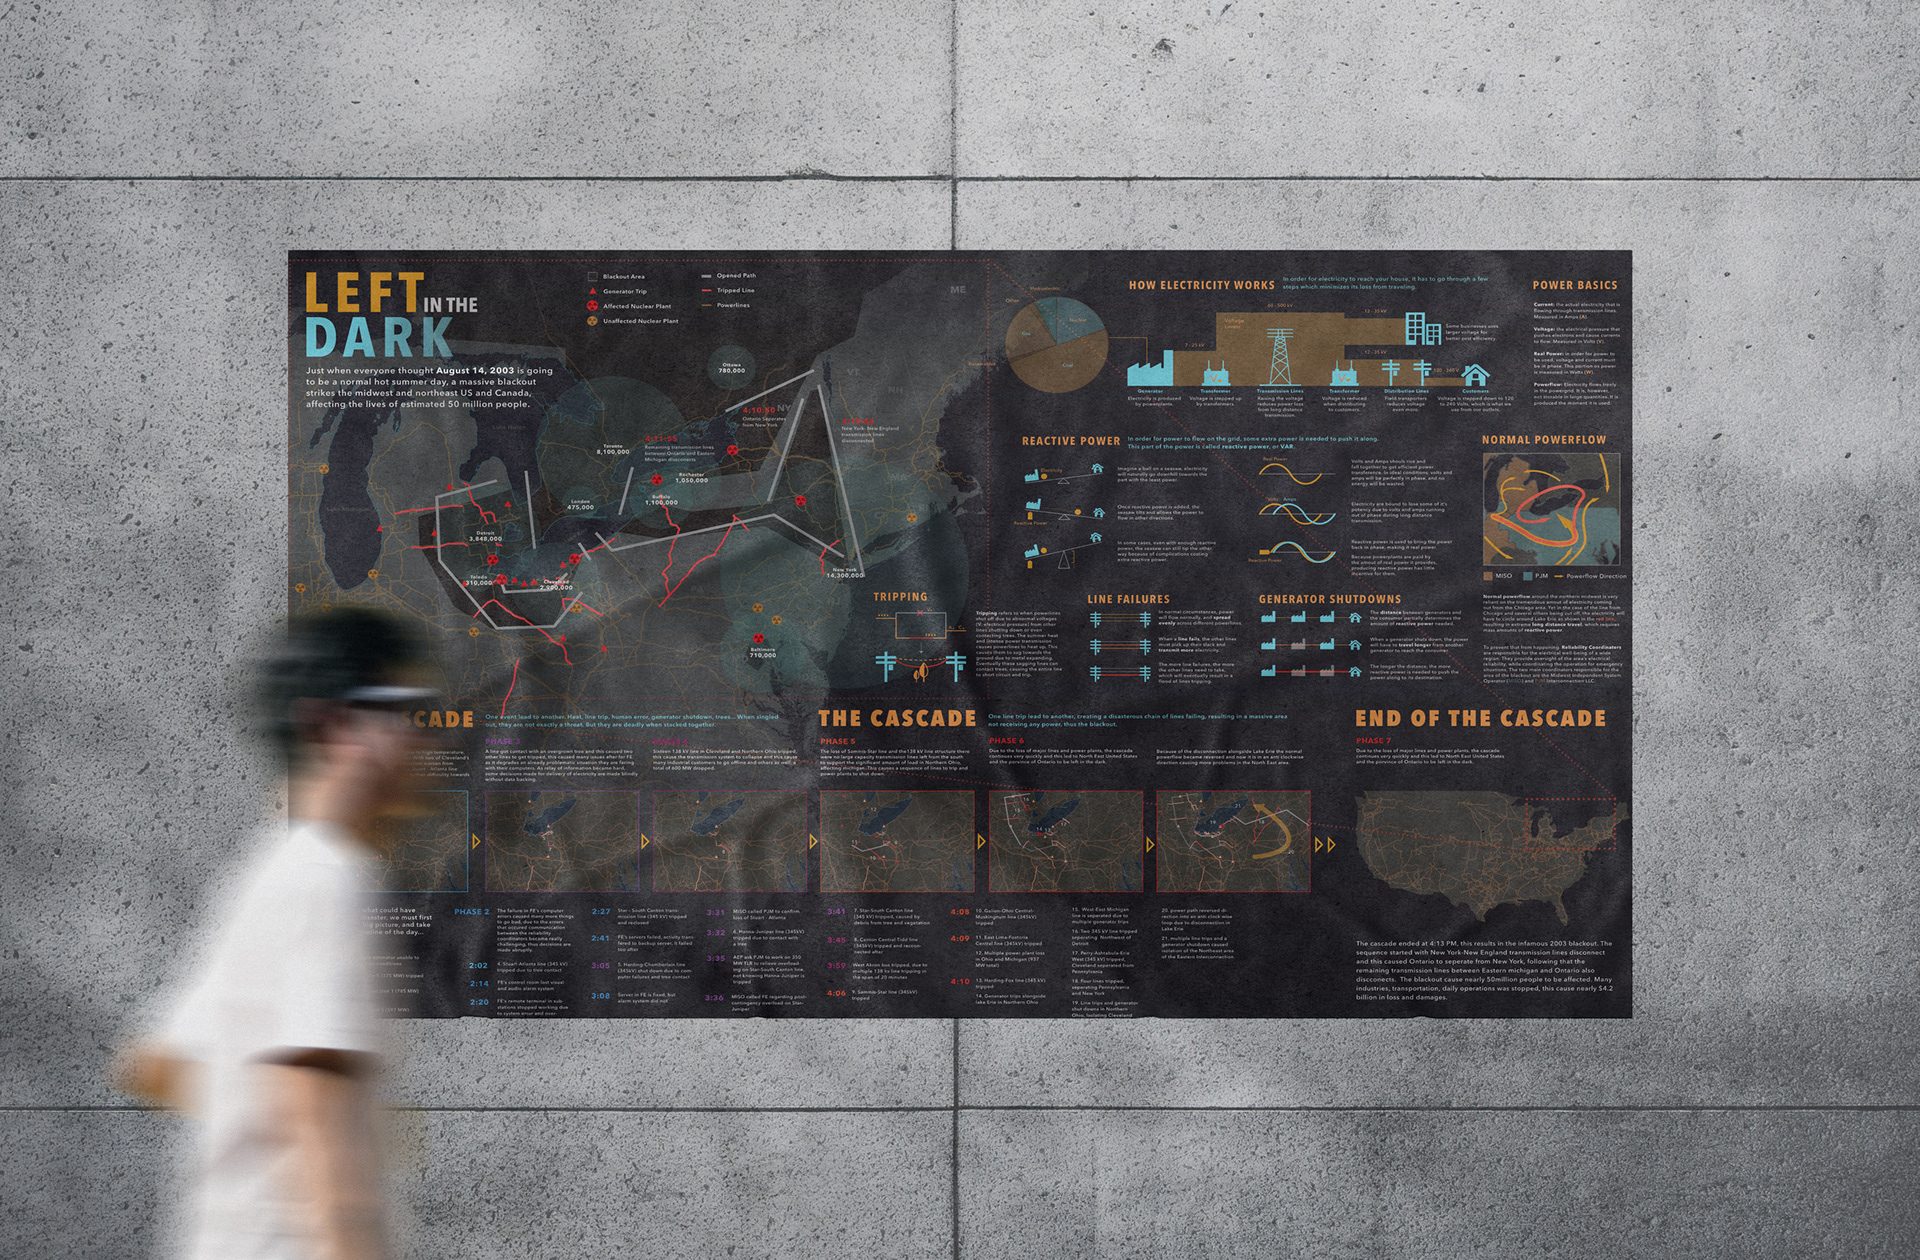
Left in the Dark.
Infographic Design | 2022 Fall
Designed an infographic that depicts the events happening in midwest America on August 14th, 2003.
With no prior knowledge of electricity, this group project was highly challenging. Having to gather information, condense information, and then crystalize them into easy-to-understand graphics.
More on this project is coming soon! Check out my other projects while you are here!~
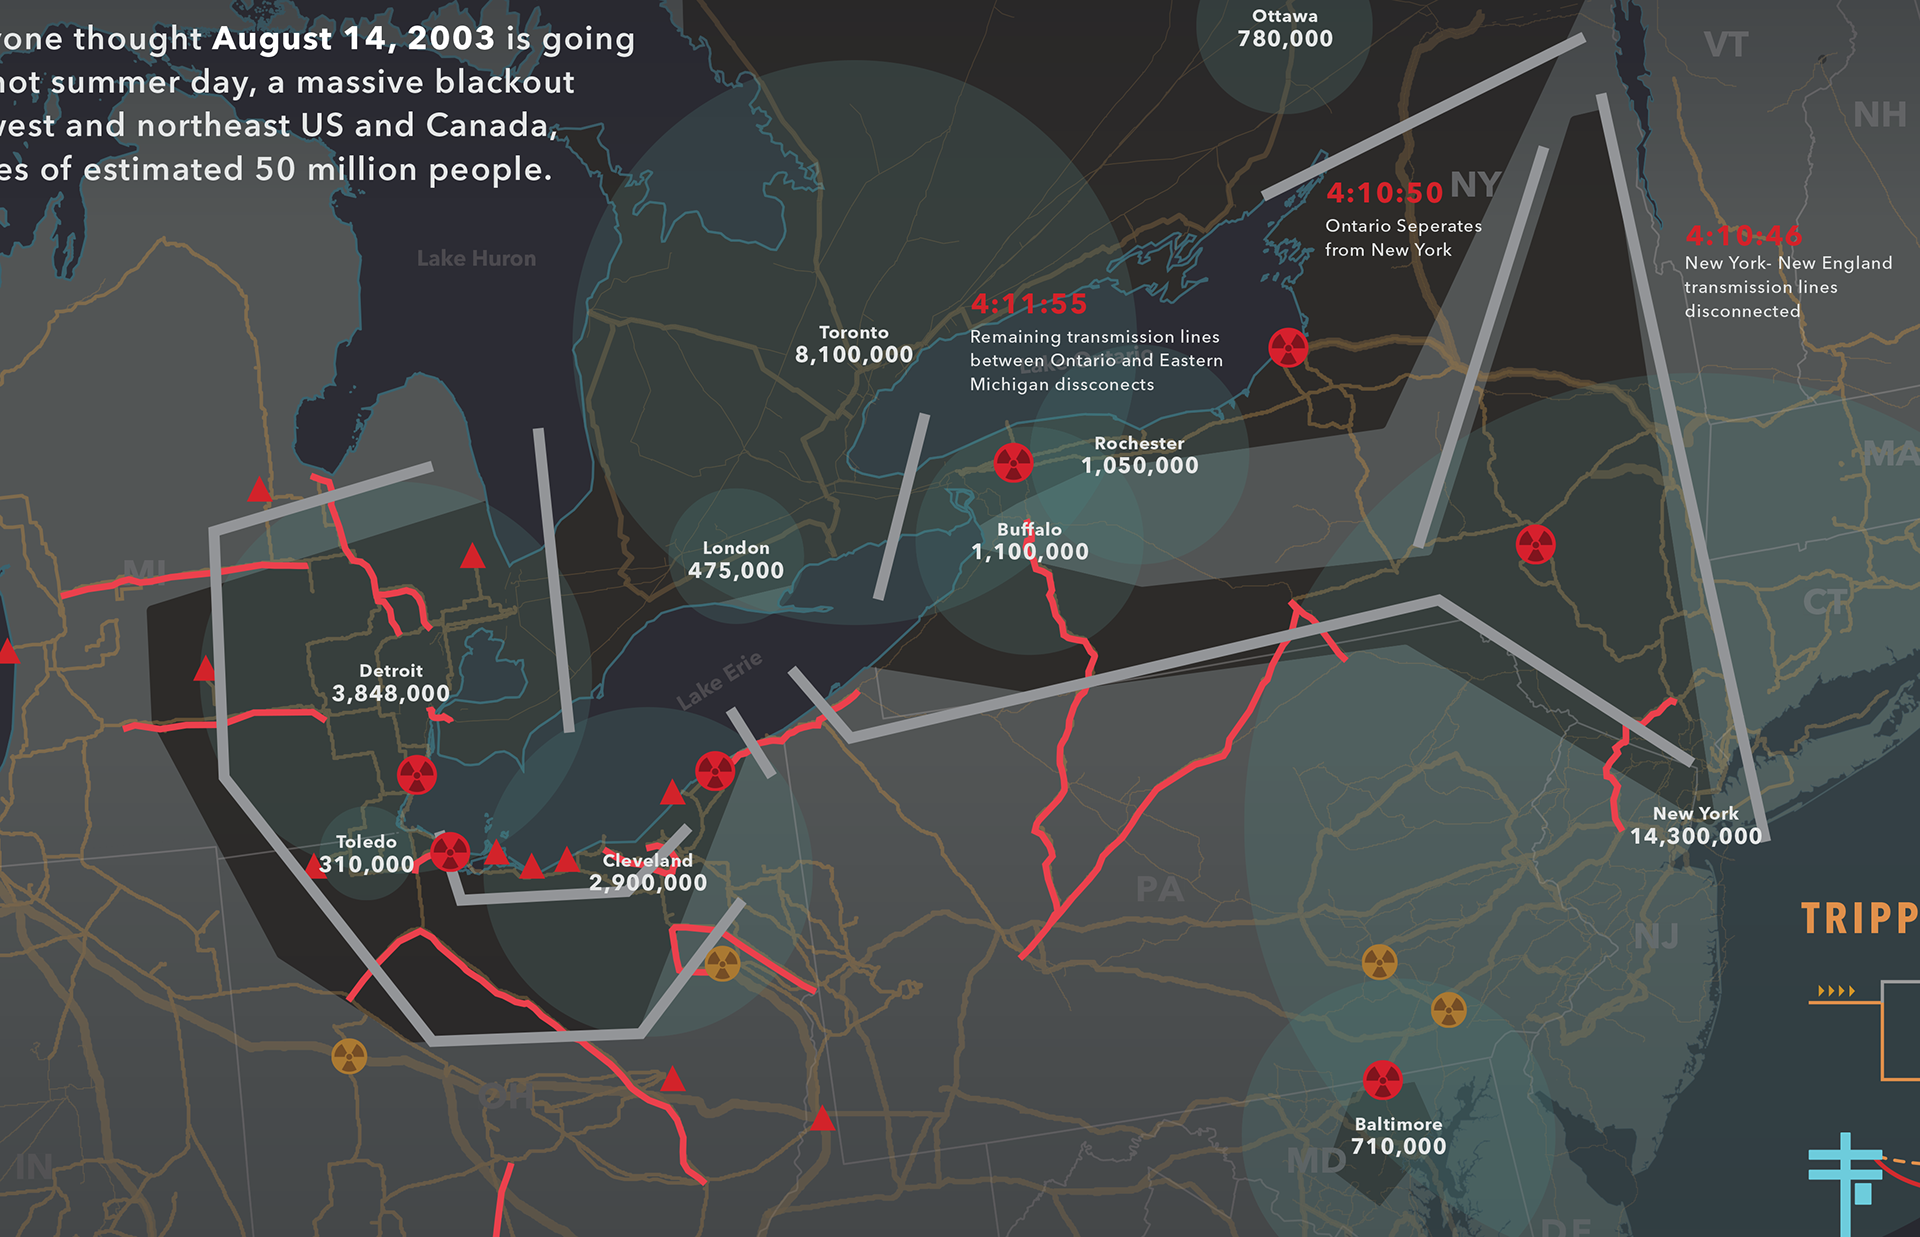
Nuclear generators, blackout areas, affected city population, major cable outages

Major power flow in the Midwest area
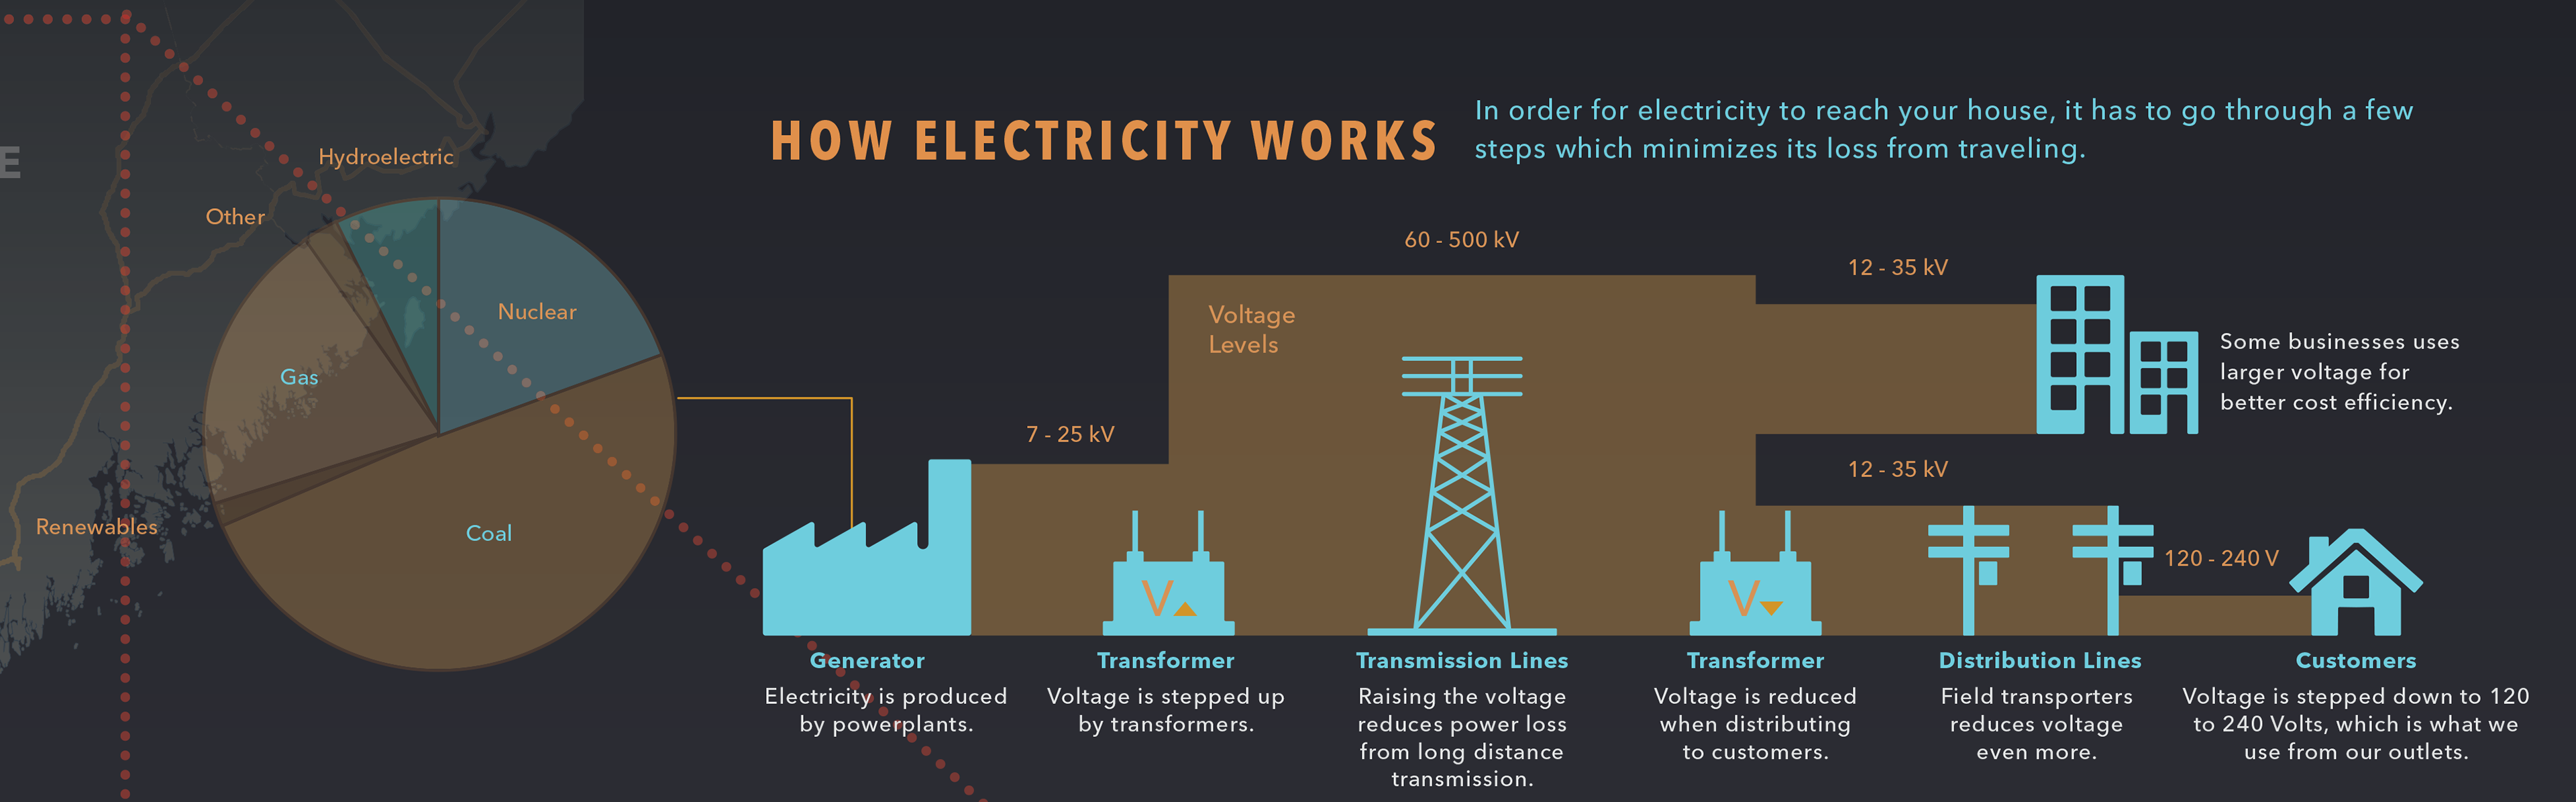
Electricity's journey to our homes
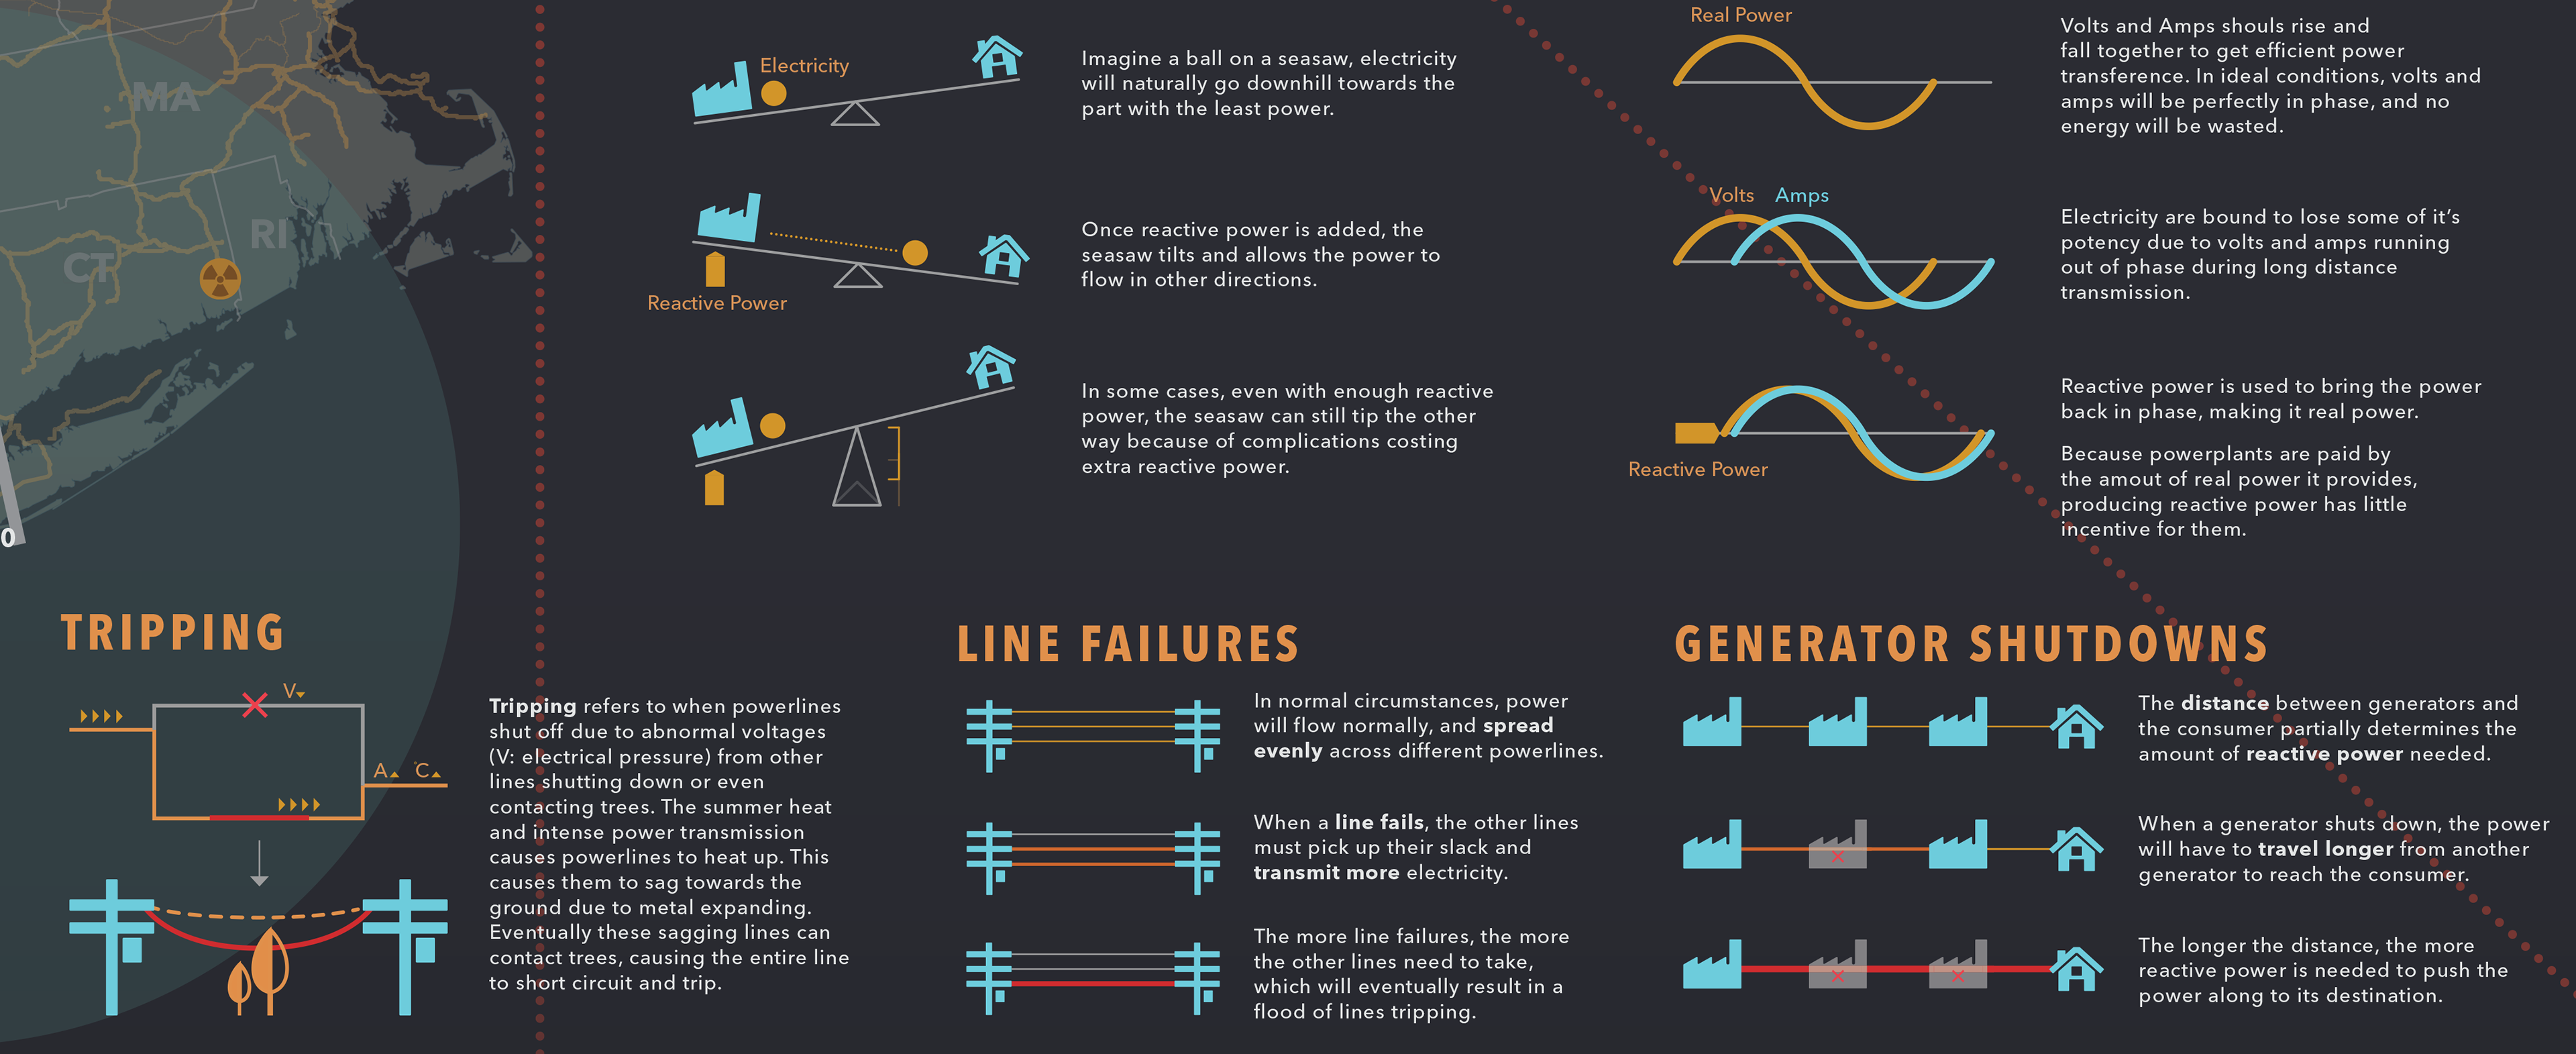
Mini guide on how electricity flows and why it's important

Credits:
Dave Orsen: Phase map design, phase description.
Bei Lin: Main map design, Graphic Icons design, Layout design, information write-up.
Dave Orsen: Phase map design, phase description.
Bei Lin: Main map design, Graphic Icons design, Layout design, information write-up.